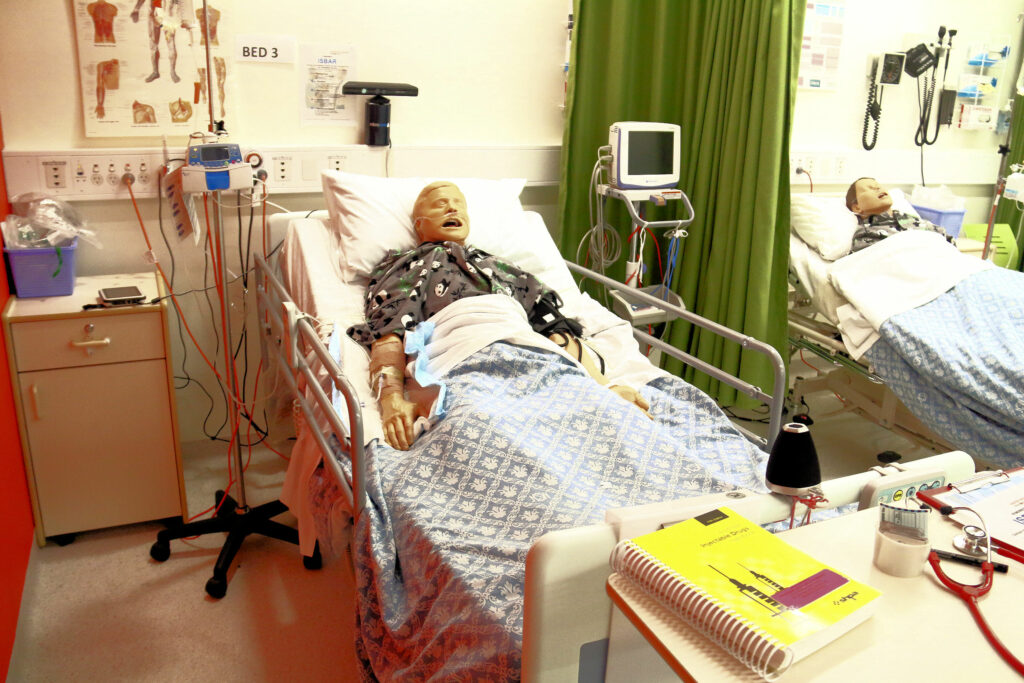
We are collaborating with the UTS Clinical Simulation team at the Faculty of Health to explore the potential that multimodal learning analytics can bring to generate reflection in Healthcare simulations using patient manikins. Healthcare simulations are hands-on learning experiences aimed at allowing students to practice essential skills that they may need when working with real patients in clinical workplaces. Some clinical classrooms at UTS are equipped with patient manikins that can respond to actions or that can be programmed to deteriorate over time. Students can perform assessments and interventions, and enhance their critical thinking and communication skills.
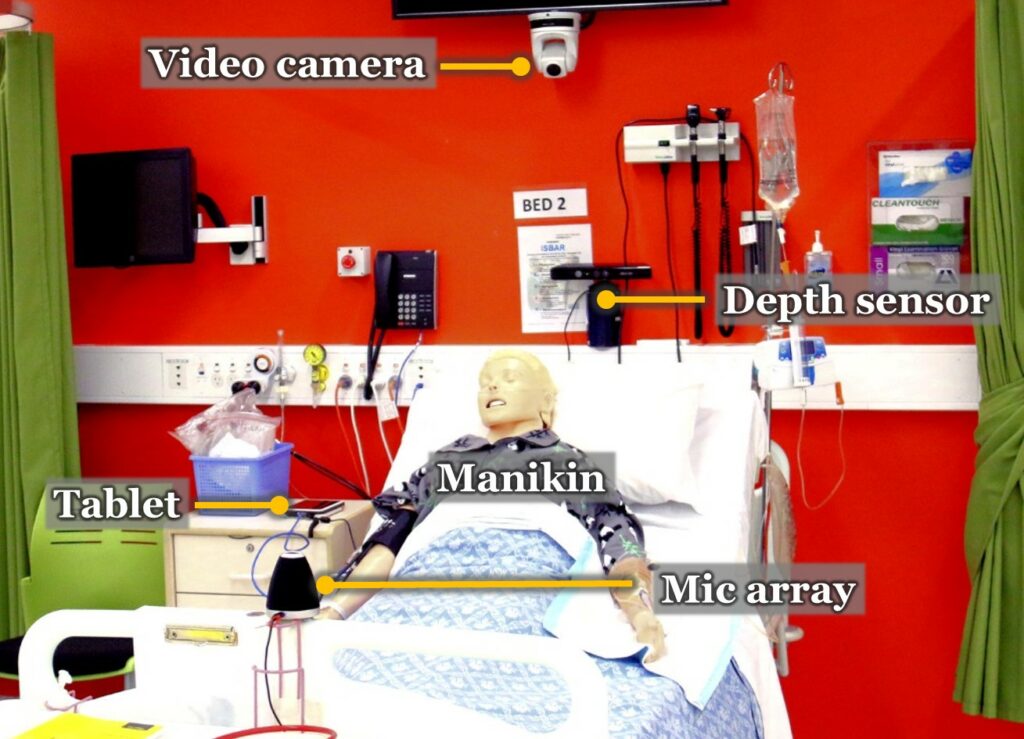
Healthcare simulations are integrated into the Bachelors of Nursing and Midwifery at the University of Technology Sydney. Simulation classrooms are equipped with 5-6 patient manikins that produce indicators of a patients’ health, respond to actions and can be pre-set to deteriorate over time. Each manikin is on a clinical bed which, in this case, was equipped with a depth sensor to track students around it. Students have to apply their health care knowledge and skills to oversee a patient manikin in a hypothetical clinical scenario.
There is an opportunity to exploit the students’ digital traces that these manikins can pervasively capture to make key aspects of the learning process visible. The setting can be augmented with sensors to capture traces of group interaction. These multimodal data can be used to generate visualisations or feedback for students or teachers. The challenge here is that, although students are required to reflect about the task, they do not have access to any evidence about how they performed. Teachers commonly have to divide their attention among multiple small teams working simultaneously and only rely on what they can partially observe in each bed to provide feedback.
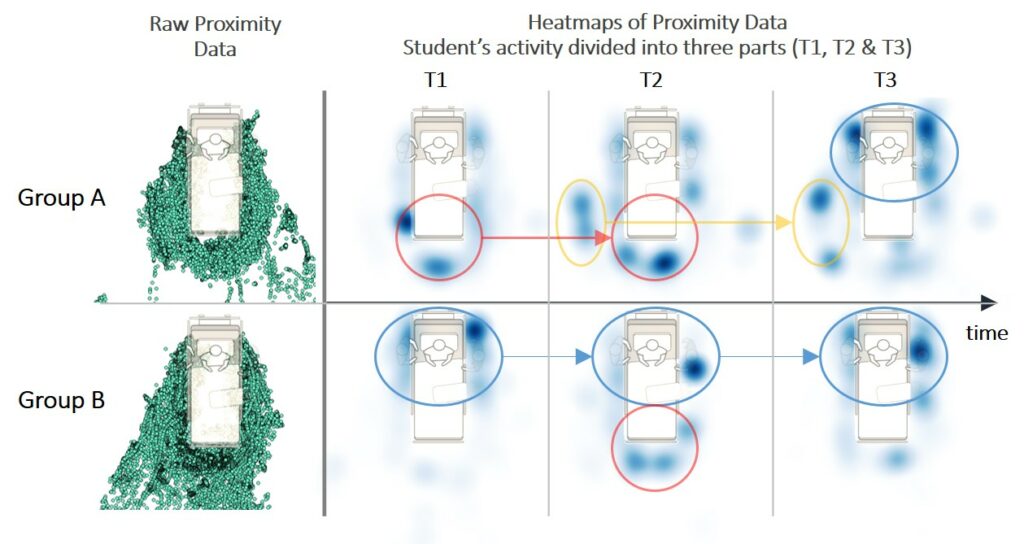
One potential that proximity analytics can bring to this learning scenario is that a feasible source of student’s behavioural evidence is the tracked position of the students around the manikin, which can help to describe how group members approach the tasks, the processes they follow before performing actions on the manikin and behaviour according to learners’ roles. For example, the figure below shows the data of two groups of 4-5 students each. The first column in Figure 1 shows the raw data captured in a whole classroom session where each data point corresponds to the distance and position of each student around the manikin. Up to 30 proximity data points per second are captured for each student standing around the manikin. The sense making of these data starts to unfold when adding spatiotemporal dimensions. E.g., Figure 1 (columns 2-4) shows heatmaps of proximity data with the activity divided in three parts. This unveils that Group A stayed mostly away from the patient during the first two thirds of the task (see red and orange ovals in thirds T1 and T2) to then work near the patient only during the last part of the activity (see blue ovals in T3). By contrast, Group B followed a very different approach by engaging with the patient from the beginning of the task and maintaining proximity throughout (see blue ovals in T1-3). This preliminary example shows how proximity and mobility data, when visualised in intuitive ways, could provoke productive reflection on the different student’s strategies.
 Raw proximity data (Column 1) and Heatmaps of student’s activity (1 hour) divided into three parts (T1, T2, T3) of 20 min. each for two groups in the same classroom: A and B. Coloured ovals mark clusters of activity near (blue), far (red) and further (orange) from the patient manikin.
This preliminary example shows how proximity and mobility data, when visualised in intuitive ways, could provoke productive reflection on the different student’s strategies. Follow the updates of this project by adding this page to your favourites!
And watch us present our research at the recent 2017 International Learning Analytics and Knowledge Conference in Canada:
This ‘Team Timeline’ can be generated almost instantaneously for the teams to debrief, and reflect on what went well, and what could have been improved (see the CHI’19 paper):

Team members:
- Dr Roberto Martinez-Maldonado, Connected Intelligence Centre, UTS
- Dr. Tamara Power, Faculty of Health, UTS
- Prof. Simon Buckingham-Shum, Connected Intelligence Centre, UTS
- Carolyn Hayes, Faculty of Health, UTS
- Vanessa Echeverria, Connected Intelligence Centre, UTS
- Carlos Prieto, Connected Intelligence Centre, UTS
- Carmen Axisa, Faculty of Health, UTS
Research outputs:
Echeverria, V., Martinez-Maldonado, R. and Buckingham Shum, S. (2019). Towards Collaboration Translucence: Giving Meaning to Multimodal Group Data. In Proceedings of ACM CHI Conference (CHI’19). ACM, New York, NY, USA, Paper 39, 16 pages. https://doi.org/10.1145/3290605.3300269 [Reprint]
Martinez-Maldonado, R., Kay, J., Buckingham Shum, S., and Yacef, K. (2019). Collocated Collaboration Analytics: Principles and Dilemmas for Mining Multimodal Interaction Data. Human-Computer Interaction, HCI, 34(1): 1-50.
Echeverria, V., Martinez-Maldonado, R. Power, T., Hayes, C., and Buckingham Shum, S. (2018) Where is the Nurse? Towards Automatically Visualising Meaningful Team Movement in Healthcare Education. International Conference on Artificial Intelligence in Education, AIED 2018. 74-78.
Martinez-Maldonado, R., Power, T., Hayes, C., Abdipranoto, A., Vo, T., Axisa, C., and Buckingham-Shum, S. (2017) Analytics Meet Patient Manikins: Challenges in an Authentic Small-Group Healthcare Simulation Classroom. International Conference on Learning Analytics and Knowledge, LAK 2017, 90-94.
Martinez-Maldonado, R., Pechenizkiy, M., Power, T., Buckingham-Shum, S., Hayes, C. and Axisa, C. (2017) Modelling Embodied Mobility Teamwork Strategies in a Simulation-Based Healthcare Classroom. International Conference on User Modelling, Adaptation and Personalization, UMAP 2017, 308-312.


3 thoughts on “HealthSimLAK: Multimodal Learning Analytics meet Patient Manikins”