CIC has been working closely with UTS Research, to help develop the roadmap and requirements for future systems to support researcher capability development.
“Learning” isn’t just what students do in degrees, it’s now a lifelong process, certainly for professionals, and increasingly for citizens simply to stay up to date with the pace of societal change. A key group of working professionals at any university is, of course, academic researchers, who have their own career trajectories and choices to make.
Enabling those choices are a researcher’s capabilities, articulated at UTS by the Research Outcomes Capability Framework. CIC’s expertise in human-centred analytics design has been contributing to the roadmap for future support systems to build such competencies, particularly around data/analytics-powered tools of course.
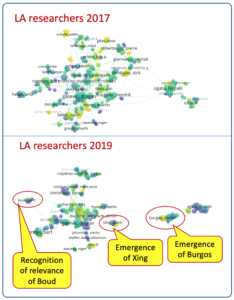
One example is the emerging family of systems containing data about researchers’ activities, such as publications, grants, leadership positions and collaborations. Network analytics enable the mapping of partnerships between authors and institutions, and publication citations, in combination with text analytics that can identify, for instance, the dominant topics in the literature produced by a given person, team, or field. Following prototyping and evaluation pilots last year, 2021 will see further R&D to deliver practical tools for researchers. In the example shown here, two annual snapshots of the network of researchers can be compared, in order to recognise the emergence of new author-networks clusters by 2019, not present in 2017.
One software tool used to perform these kinds of analytics is VOSviewer, and a training module is now available for UTS researchers to get hands-on with this. As CIC’s Simon Buckingham Shum says in his welcome video, why not “put your research on the map” — literally — to see how it looks! (UTS-intranet training module)
