
CIC provides UTS with both thought leadership and hard evidence about Learning Analytics. So it’s no surprise that the team will present multiple times at the premier international forum next month…
Universities risk implementing data/analytics strategies that make little impact on real practice, if they don’t work closely with the academics, tutors and students who are expected to use those new tools. This human-centred design approach is one of CIC’s hallmarks, so running through our work you’ll see a concern for how we earn the trust of these stakeholders through careful co-design of the technologies, and in-depth understanding of how they fit into the realities of university teaching and learning.
This flavour of work gives us a distinctive international reputation in Learning Analytics for higher education, and next month we’ll be (virtually) at the International Conference on Learning Analytics & Knowledge where we’ll co-lead workshops and present a range of research papers.
Building Open Science and Scholarship in SoLAR (Workshop)
Bart Rienties, Christopher Brooks, Simon Buckingham Shum, Rebecca Ferguson and Maren Scheffel
Monday 21st March, 9:00 AM – 12:00 PM PST, Pre-Conference Workshop
 This SoLAR initiated workshop aims to bring together the SoLAR community to explore how open science and scholarship can be incorporated into our culture and practice using a three-part interactive format. Amongst the questions to be discussed are: What could and should SoLAR do to encourage open science and scholarship?; What prevents researchers in SoLAR from contributing to open science?; Which learning analytics approaches could (not) be made open, and why?; And what could SoLAR do to make open science and scholarship more attractive and relevant? We aim to share the outcomes of the workshop broadly within the SoLAR community and invite the community to respond to both the outcomes of this workshop and the follow-up SoLAR position paper. [Workshop Website]
3rd Workshop on Personalising Feedback at Scale (Workshop)
Lisa-Angelique Lim, Caitlin Hayward, Benjamin Hayward, Holly Derry, Rebecca Matz, Danny Liu, Mette Trier Damgaard
Tuesday 22nd March, 3:00 – 6:00 AM PST, Pre-Conference Workshop
 Advances in learning analytics have led to a proliferation of data-informed solutions for delivering personalised feedback to students at scale. A very recent trend has also seen the use of learning analytics approaches to create data-informed educational nudges. However, little research exists to guide practitioners regarding the characteristics of effective personalised feedback and educational nudges. This workshop is the third in a series of workshops delivered at LAK which explored tools and applications for personalised feedback, and how students perceived such feedback. In this 3-hour, interactive workshop, we explore examples of how educators and system developers can co-design personalised feedback and nudge processes in ways that promote students’ engagement with this feedback. The workshop has three primary goals: (1) Reflect on the current adequacy of our multidisciplinary conceptual foundations for practitioners and researchers in LA for effective learning analytics feedback practices in HE; (2) Share approaches for scaling personalised feedback with particular attention to how data are used to inform personalisation, as well as the processes for personalised, dialogic feedback (e.g., timing, content, modality); (3) Promote reflection on both pedagogical and technological approaches to improve feedback practices targeted at the improvement of student learning and their ability to self-regulate learning. [Workshop Website]
Questioning learning analytics? Encouraging critical engagement with automated feedback
Antonette Shibani, Simon Knight and Simon Buckingham Shum
Wednesday 23rd March, 5:30 – 6:00 PM PST, Feedback & Learning Analytics – Sessions A4
 For learning analytics to empower students, they must be able to critically engage with the analytics. This is particularly essential in the case of student-facing LA (such as automated writing feedback tools) that require students to make sense of the automated feedback on learning constructs that the students must master, and to act as needed. This paper highlights the importance of critical engagement with a learning analytics tool and a pedagogic design for its implementation with students. It uses student interaction data to demonstrate that students possess different levels of skills to meaningfully engage with the automated feedback and discusses ways to build this capability to enhance students’ critical engagement with learning analytics. The work will inform how learning analytics tools can embed critical interaction design to benefit its users and provide them with increased agency. [PDF]
We’ve pulled it all together into this handy package for you to get your sneak preview! Dates will be added once the program is out…
Beyond the Learning Analytics Dashboard: Alternative Ways to Communicate Student Data Insights Combining Visualisation, Narrative and Storytelling
Gloria Milena Fernandez-Nieto, Kirsty Kitto, Simon Buckingham Shum and Roberto Martinez-Maldonado
Thursday 24th March, 5:00 – 5:30 PM PST, Visual Representation of Learning Analytics – Sessions C8
 Learning Analytics (LA) dashboards have become a popular medium for communicating the analytical insights obtained from student data to teachers. However, recent research has suggested that LA dashboards can be complex to interpret, are often not grounded in educational theory, and commonly do not provide guidance about how to interpret them. Despite these acknowledged problems, few suggestions have been made as to how we might improve the visual design of LA tools to support richer and alternative ways to communicate student data insights. In this paper, we explore three design alternatives to represent student multimodal data insights by combining data visualisation, narratives and storytelling principles. Based on foundations of data storytelling, three visual-narrative interfaces were designed with teachers: i) visual data slices, ii) a tabular visualisation, and iii) a written report. These were validated as a part of an authentic study where teachers explored activity logs and physiological data from co-located collaborative learning classes in the context of healthcare education. Results suggest that alternatives to LA dashboards can be considered as effective tools to support teachers’ reflection and that LA designers should identify the representation type that best fit teachers’ needs. [PDF]
Thinking with causal models: A visual formalism for collaboratively crafting assumptions
Ben Hicks, Kirsty Kitto, Leonie Payne and Simon Buckingham Shum
Thursday 24th March, 5:30 – 6:00 PM PST, Visual Representation of Learning Analytics – Sessions C8
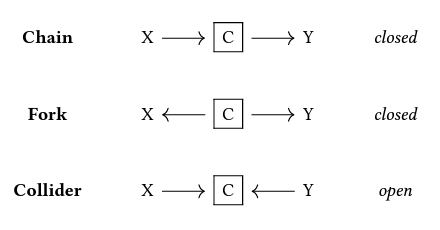 Learning Analytics (LA) is a bricolage field that requires a concerted effort to ensure that all stakeholders it affects are able to contribute to its development in a meaningful manner. We need mechanisms that support collaborative sense-making. This paper argues that graphical causal models can help us to span the disciplinary divide, providing a new apparatus to help educators understand, and potentially challenge, the technical models developed by LA practitioners as they form. We briefly introduce causal modelling, highlighting its potential benefits in helping the field to move from associations to causal claims, and illustrate how graphical causal models can help us to reason about complex statistical models. The approach is illustrated by applying it to the well known problem of at-risk modelling. [PDF]