As we drown in information, “dashboards” have become pervasive, but how we present the information to the end user is a challenge. Dashboards are often too complex with users bombarded with information that may not be relevant. Let’s take education as an example, where dashboards are being designed to help students with different aspects of their learning, for example, managing time effectively, accessing key learning resources, or gaining a richer picture of their progress.
But here’s the problem. The evidence is that many dashboards are poorly designed, rarely evaluated with students or educators, and poorly integrated with the learning objectives. If we are to create dashboards for students to help them with their learning, how do we determine what’s relevant and critical for them?
 Data Storytelling may give us a clue. Data Storytelling is widely used by professionals (e.g. data journalists) to effectively communicate stories. Data Storytelling uses narrative devices and visual design principles to foreground key features in the data visualisation (e.g. graphs and charts). We are drawing on those principles, but this doesn’t resolve a key question — what story should we tell, to ensure that students draw appropriate conclusions from their dashboards?
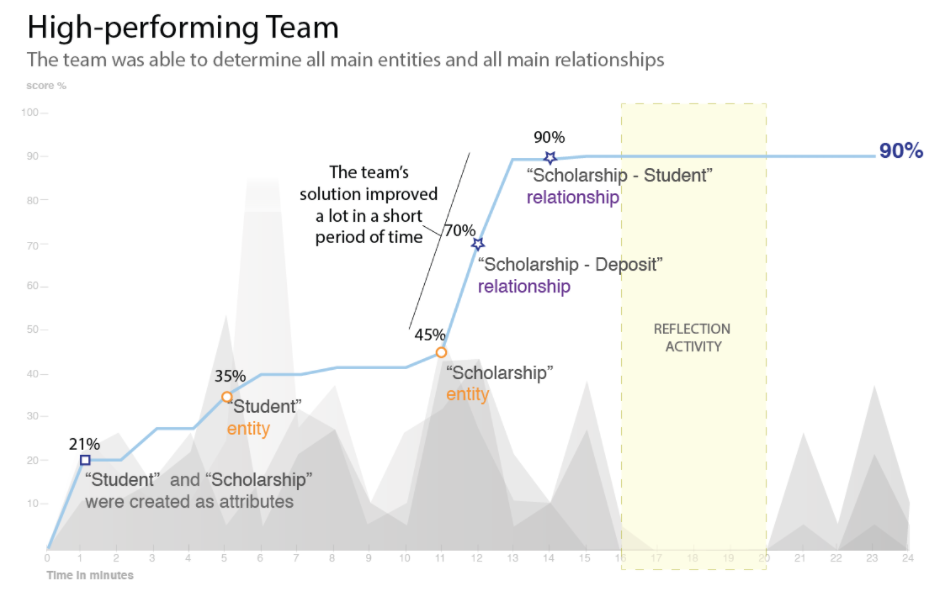
This is where we need to incorporate the pedagogical context, which is often referred to as the Learning Design. Consultation with educators allows us to identify the key aspects of a data visualisation that are most relevant to students’ learning. The image is an example of how we use data storytelling in a learning dashboard, by overlaying narrative elements to foreground key messages around data points.
Our evidence from evaluating these is that integrating data storytelling into learning dashboards could be an important advance in user-centred Learning Analytics.
This work is part of the research by CIC PhD student Vanessa Echeverria, supervised by Simon Buckingham Shum, and Roberto Martinez-Maldonado, with collaborators from ESPOL (Ecuador) and University of British Columbia (Canada).
Learn more about this work:
Echeverria, V., Martinez-Maldonado, R. Granda, R., Chiluiza, K., Conati, C., and Buckingham Shum, S. (2018) Driving Data Storytelling from Learning Design. International Conference on Learning Analytics and Knowledge, LAK 2018, 131-140. [slides]
Echeverria, V., Martinez-Maldonado, R. and Buckingham Shum, S. (2017) Towards Data Storytelling to Support Teaching and Learning. Australian Conference on Human-Computer Interaction, OZCHI 2017, 347-351.